Introduction
A best fit line is a mathematical model used to represent relationships between two variables. It is also known as a regression line, and is used to show the general trend of a set of data points. By plotting a best fit line, it is possible to make predictions about future values or examine the relationships between different variables. In this article, we will explore what a best fit line is, why it is useful, and how it can be applied in various contexts.
Explaining the Concept and Applications of Best Fit Lines
A best fit line is a line that is drawn through a set of data points in order to represent the general trend of the data. The line is not necessarily the same as the data points, but rather an approximation of the overall trend. The goal of a best fit line is to minimize the sum of the squared distances between the line and the data points.
The equation for a best fit line is y = mx + b, where m is the slope of the line and b is the y-intercept. To calculate a best fit line, the least squares method is used. This involves finding the values of m and b that minimize the sum of the squared distances between the line and the data points. Once these values have been found, the equation of the best fit line can be determined.
Best fit lines are used in many different contexts. For example, they can be used to examine the relationship between two variables, such as the price of a stock and its volume traded. They can also be used to predict future values, such as the expected price of a stock at a certain date. Additionally, best fit lines can be used to visualize data, such as creating charts and graphs to illustrate trends.
Understanding the Math Behind Best Fit Lines
The mathematics behind best fit lines can be broken down into three main types: linear regression, polynomial regression, and exponential regression. Each type of regression has its own equation and can be used to model different kinds of data.
Linear regression is the most common type of regression and is used to model data that follows a straight line. The equation for linear regression is y = mx + b, where m is the slope of the line and b is the y-intercept. Linear regression can be used to model data that increases or decreases at a constant rate.
Polynomial regression is used to model data that follows a curved line. The equation for polynomial regression is y = a + bx + cx2 + dx3 + …, where a, b, c, d, etc. are constants determined using the least squares method. Polynomial regression can be used to model data that increases or decreases at a non-constant rate.
Exponential regression is used to model data that follows an exponential curve. The equation for exponential regression is y = abx, where a and b are constants determined using the least squares method. Exponential regression can be used to model data that increases or decreases exponentially.
Using Best Fit Lines to Make Predictions
Once a best fit line has been determined, it can be used to make predictions about future values. The equation of the best fit line can be used to estimate the value of a variable for any given value of the other variable. For example, if a best fit line is calculated for the relationship between the price of a stock and its volume traded, the equation can be used to estimate the expected price of the stock for any given volume.
The slope and intercept of the best fit line can also be used to make predictions. The slope tells us the rate of change between the two variables, while the intercept tells us the value of the dependent variable when the independent variable is zero. For example, if the best fit line has a slope of 0.5 and an intercept of 10, this means that for every increase of 1 in the independent variable, the dependent variable will increase by 0.5, and when the independent variable is zero, the dependent variable will be 10.
Examining Different Types of Best Fit Lines
There are several different types of best fit lines that can be used to model different kinds of data. Simple linear regression is used to model data that follows a straight line, while multiple linear regression is used to model data that follows a more complex pattern. Non-linear regression is used to model data that follows a curved or exponential line.
In addition to these, there are also other types of best fit lines that can be used to model data with more than two variables. These include multiple regression, logistic regression, and polynomial regression. Each type of regression has its own equation and can be used to model different kinds of data.
Visualizing Data with Best Fit Lines
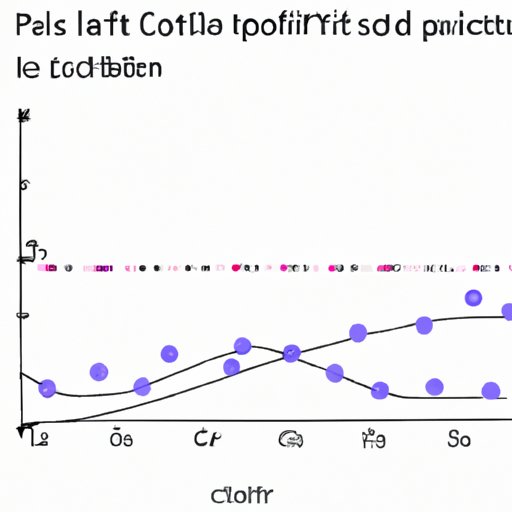
Best fit lines can also be used to visualize data. By plotting a best fit line on a chart or graph, it is possible to see the general trend of the data. This can be useful for identifying patterns and trends in the data. Additionally, best fit lines can be used to compare different sets of data, as well as to compare different models.
When visualizing data with best fit lines, it is important to consider the type of regression being used. For example, if a simple linear regression is being used, the line should follow a straight line. If a polynomial regression is being used, the line should follow a curved line. Additionally, it is important to consider the range of the data and the size of the data points, as these can affect the appearance of the line.

Analyzing Trends with Best Fit Lines
Best fit lines can also be used to analyze trends in data. The correlation coefficient of the best fit line can be used to measure the strength of the relationship between two variables. A correlation coefficient of 1 indicates a perfect positive correlation, while a correlation coefficient of -1 indicates a perfect negative correlation. Outliers can also be identified by looking for data points that lie far from the best fit line.
It is also possible to use best fit lines to identify cause and effect relationships. For example, if the best fit line shows a strong positive correlation between two variables, it is likely that one variable is causing the other. However, it is important to remember that correlation does not necessarily imply causation.
Conclusion
Best fit lines are mathematical models used to represent relationships between two variables. They can be used to make predictions, visualize data, and analyze trends. There are several different types of best fit lines, including linear, polynomial, and exponential regression. By understanding the concept, math, and applications of best fit lines, it is possible to use them effectively to gain insights into data.
(Note: Is this article not meeting your expectations? Do you have knowledge or insights to share? Unlock new opportunities and expand your reach by joining our authors team. Click Registration to join us and share your expertise with our readers.)