Introduction
Excel is a powerful software program used by millions of people around the world to manage data and create reports. While it can be a great tool for organizing and analyzing data, it can also be time-consuming and tedious to manually create reports in Excel. Fortunately, there are several ways to automate this process and make it easier to generate accurate, up-to-date reports quickly and efficiently. In this article, we’ll explore how to automate Excel reports by leveraging the power of VBA macros, add-ins, pivot tables, formulas, and conditional formatting.
Utilizing VBA Macros to Automate Excel Reports
Visual Basic for Applications (VBA) is a programming language used to create macros that can automate tasks in Excel. A macro is a set of instructions written in VBA code that can be used to execute a series of steps, such as creating a report or importing data from an external source. To use VBA macros, you must first enable the Developer tab in Excel and then write the code for the macro. Once the code is written, you can run the macro with a single click, making it much faster and easier to generate reports.
Using VBA macros to automate Excel reports has several advantages. First, it allows you to quickly execute a series of tasks that would otherwise take a long time to complete manually. Second, it enables you to easily customize reports to meet different needs. Finally, it provides an easy way to integrate data from multiple sources into a single report.
Exploring Excel Add-Ins for Automating Reports
Another way to automate Excel reports is to use Excel add-ins. These are programs that are installed within Excel and provide additional functionality, such as the ability to quickly generate reports or import data from external sources. Add-ins can be downloaded from the Microsoft Office store, or from third-party websites. Once installed, they can be accessed from the Add-Ins tab in Excel.
Using add-ins to automate Excel reports offers several benefits. First, it makes it easier to quickly generate reports with minimal effort. Second, it allows you to access data from multiple sources and combine it into a single report. Finally, it simplifies the process of customizing reports to meet specific needs.
Leveraging the Power of Pivot Tables to Automate Reports
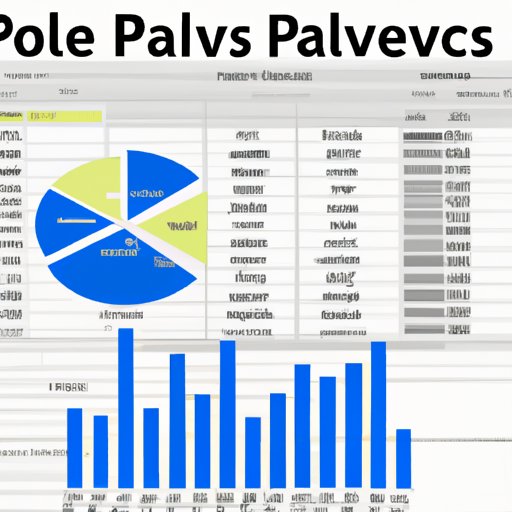
Pivot tables are an incredibly useful tool for automating Excel reports. A pivot table is a dynamic table that allows you to quickly summarize and analyze data. It automatically creates charts and graphs based on the data entered, and can be used to easily generate reports without having to manually enter information. To use a pivot table, you simply select the data you want to include in the report, and then drag and drop it into the pivot table. The table will automatically update and generate the report.
Using pivot tables to automate Excel reports offers several advantages. First, it makes it easier to quickly generate reports from large datasets. Second, it enables you to quickly analyze data and identify trends and correlations. Finally, it simplifies the process of summarizing and presenting data in a visually appealing format.

Designing Formulas and Functions to Create Automated Reports
Formulas and functions are another effective way to automate Excel reports. Formulas are equations used to calculate values in cells, while functions are pre-defined formulas that can be used to perform calculations. Formulas and functions can be used to quickly generate reports without having to manually enter data. To use formulas and functions, you simply enter them into the appropriate cells, and Excel will automatically calculate the results.
Using formulas and functions to automate Excel reports has several advantages. First, it enables you to quickly calculate complex calculations without having to manually enter data. Second, it simplifies the process of generating reports and ensures accuracy. Finally, it makes it easier to quickly analyze data and identify trends and correlations.
Using Conditional Formatting to Automate Reports
Conditional formatting is a feature in Excel that allows you to highlight cells based on certain criteria. For example, you could use conditional formatting to highlight cells containing numbers above a certain threshold, or to highlight cells containing text that matches a certain pattern. You can also use conditional formatting to automatically generate reports. For example, you could use it to highlight cells containing data that meets certain criteria, or to create charts and graphs that display the data.
Using conditional formatting to automate Excel reports offers several advantages. First, it simplifies the process of quickly generating reports based on certain criteria. Second, it makes it easier to visualize data and identify trends and correlations. Finally, it enables you to quickly customize reports to meet different needs.
Conclusion
Automating Excel reports is an effective way to quickly and accurately generate reports without having to manually enter data. By leveraging the power of VBA macros, add-ins, pivot tables, formulas, and conditional formatting, you can simplify the process of generating reports and ensure accuracy. In addition, you can customize reports to meet specific needs and quickly analyze data to identify trends and correlations.
In summary, automating Excel reports can save you time and make it easier to generate accurate, up-to-date reports quickly and efficiently. With the right tools and techniques, you can leverage the power of automation to improve your reporting capabilities and maximize productivity.
(Note: Is this article not meeting your expectations? Do you have knowledge or insights to share? Unlock new opportunities and expand your reach by joining our authors team. Click Registration to join us and share your expertise with our readers.)